Beautiful data apps & dashboards
It's easy to build stunning, interactive data experiences with Hex, from simple reports to complex write-back UIs.
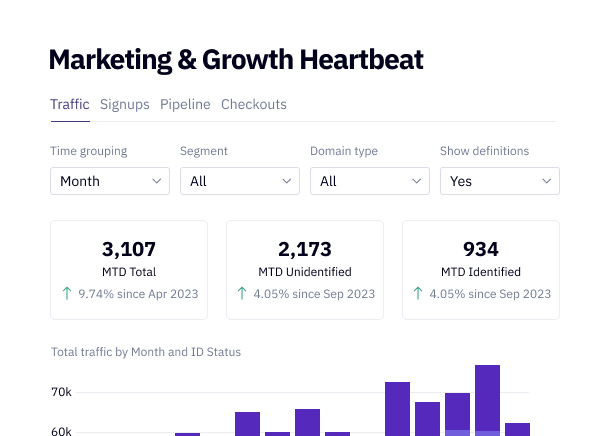
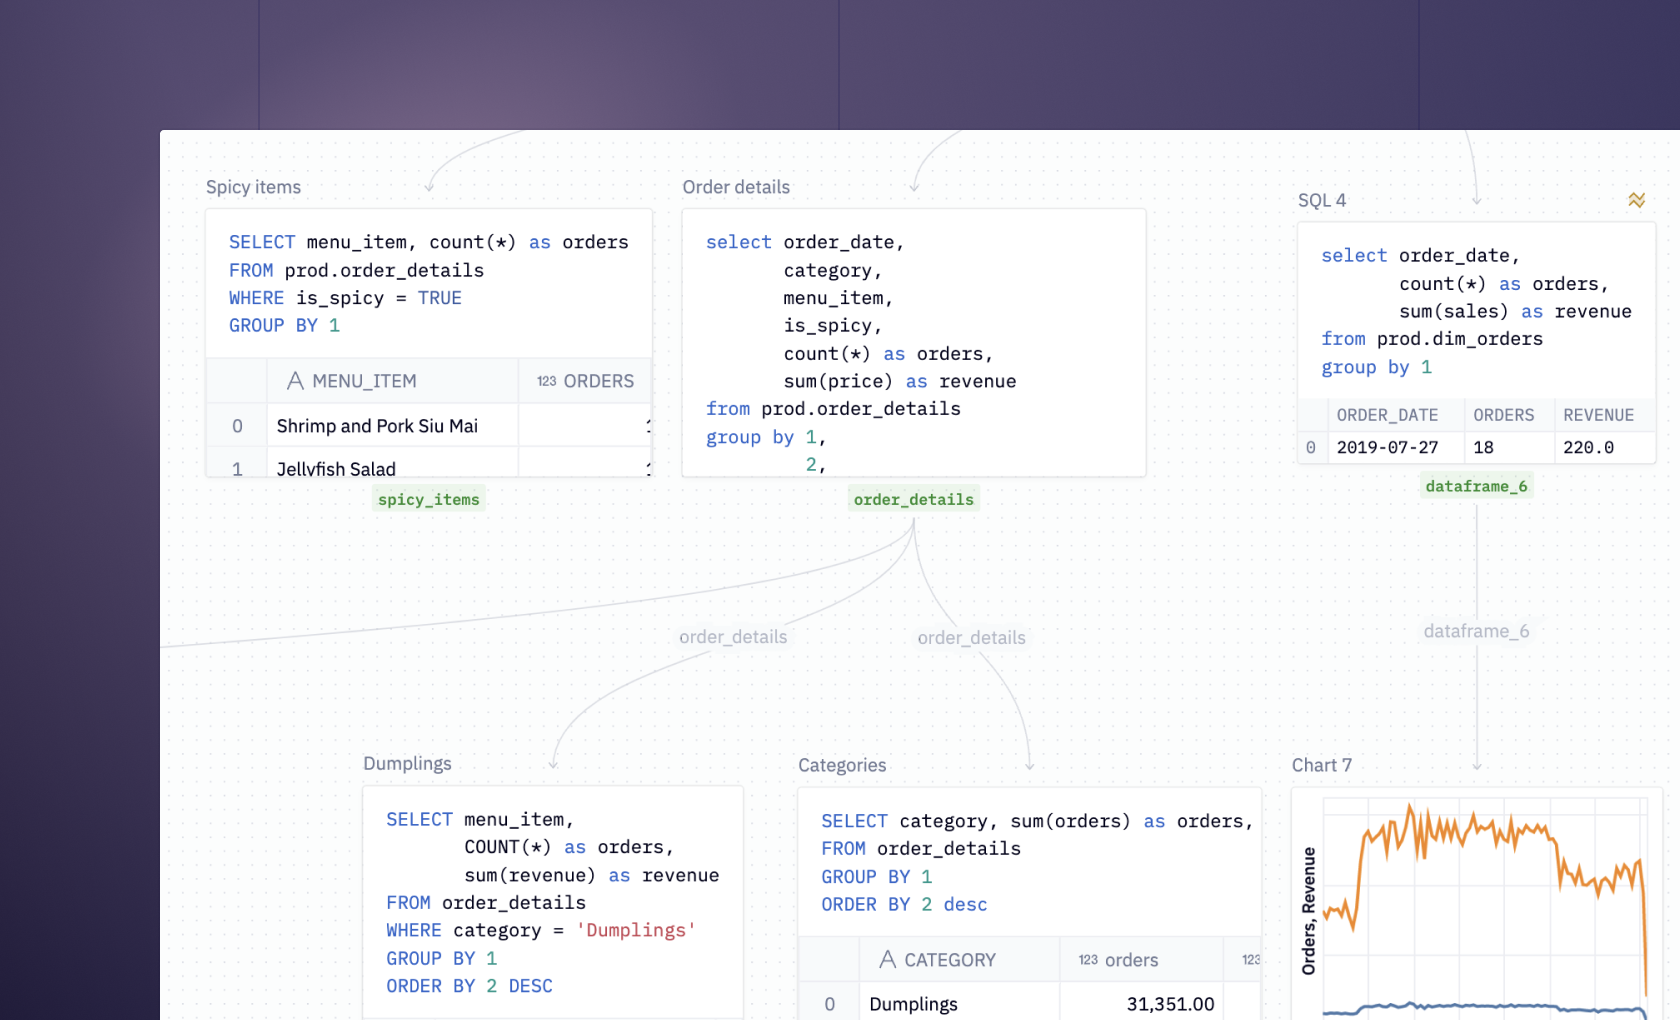
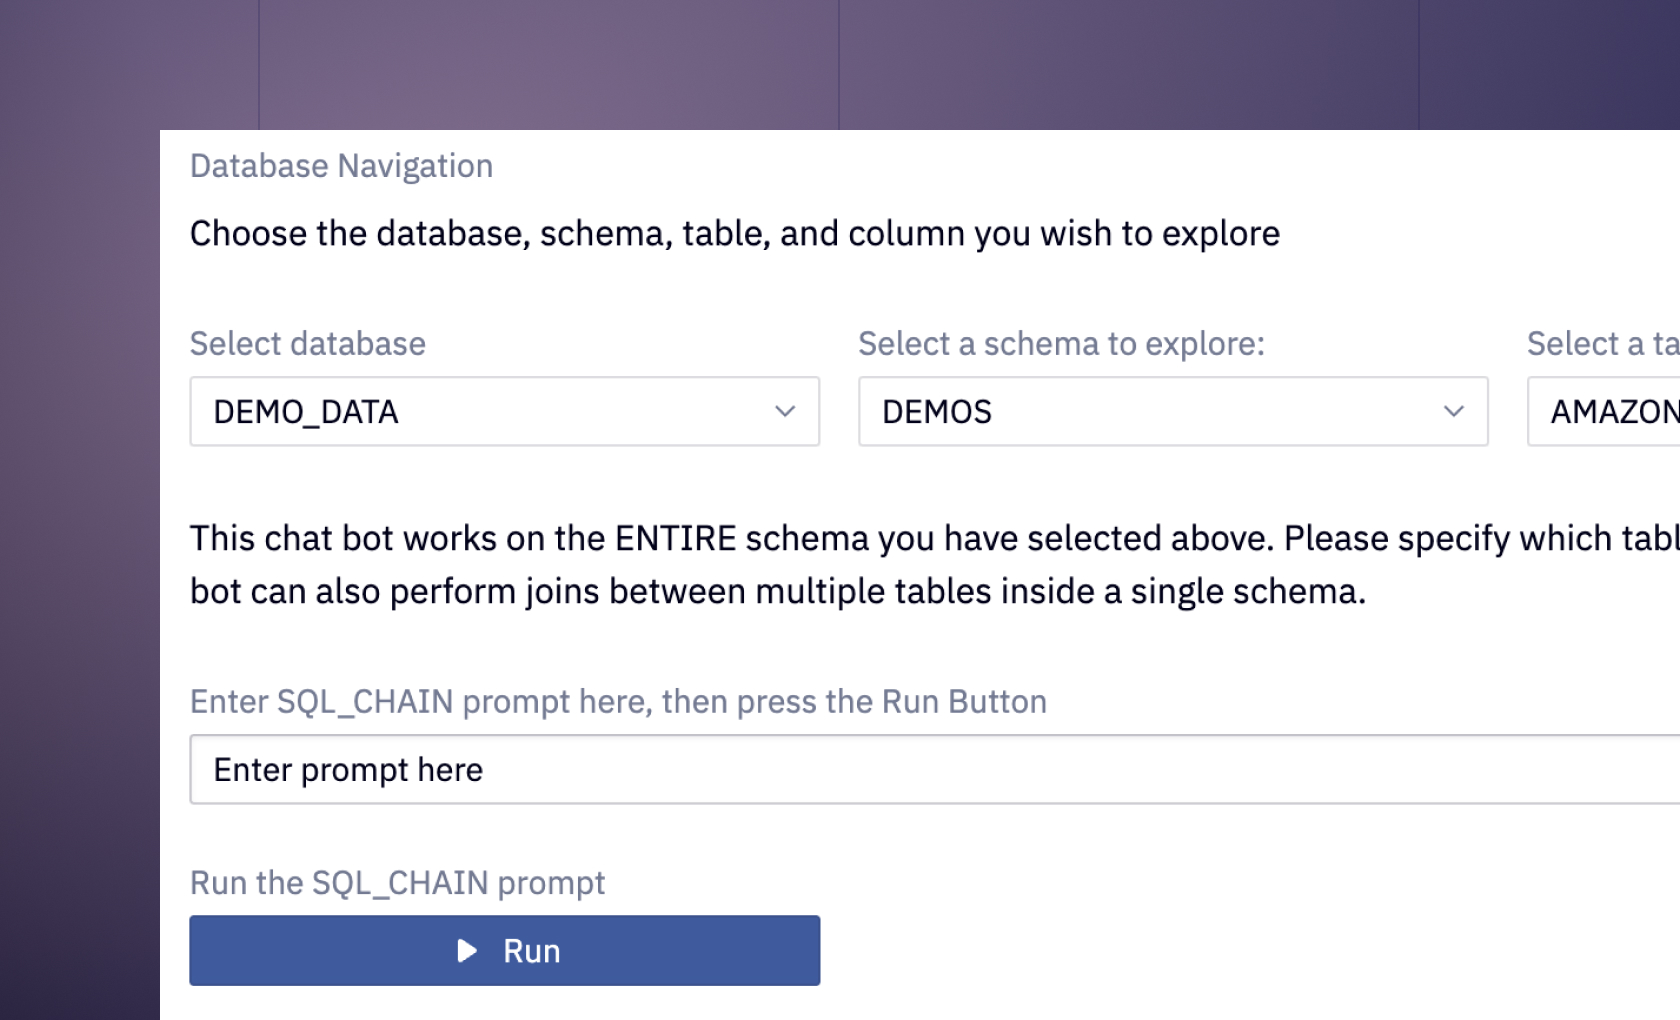
Drag, drop, data app
Hex’s app builder and complete set of components makes it easy to build interactive experiences.
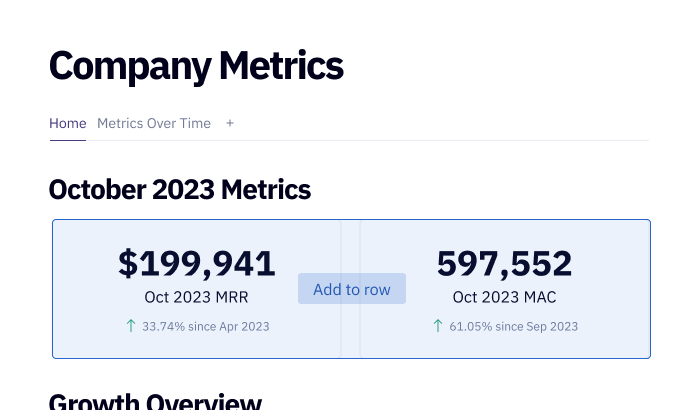
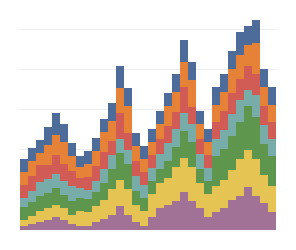
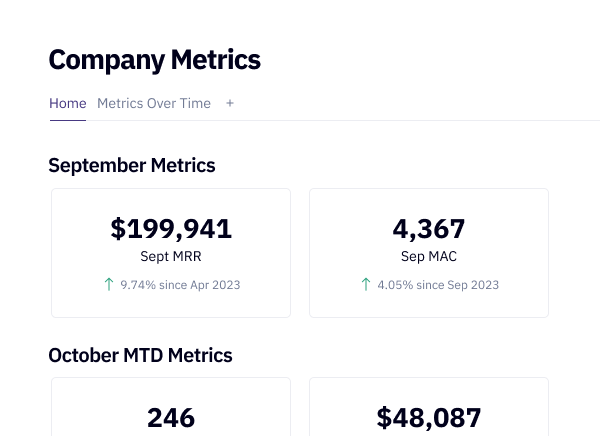
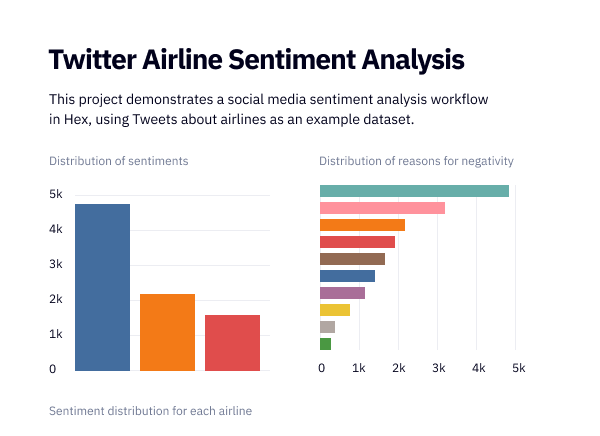
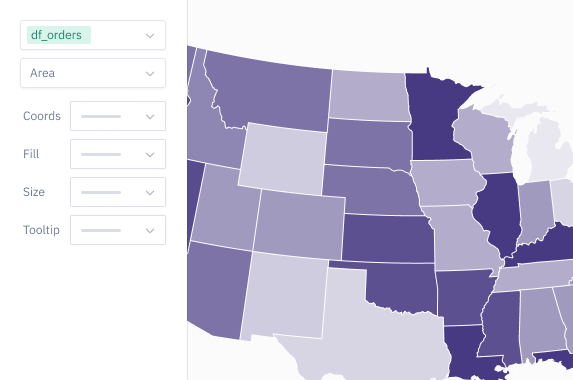
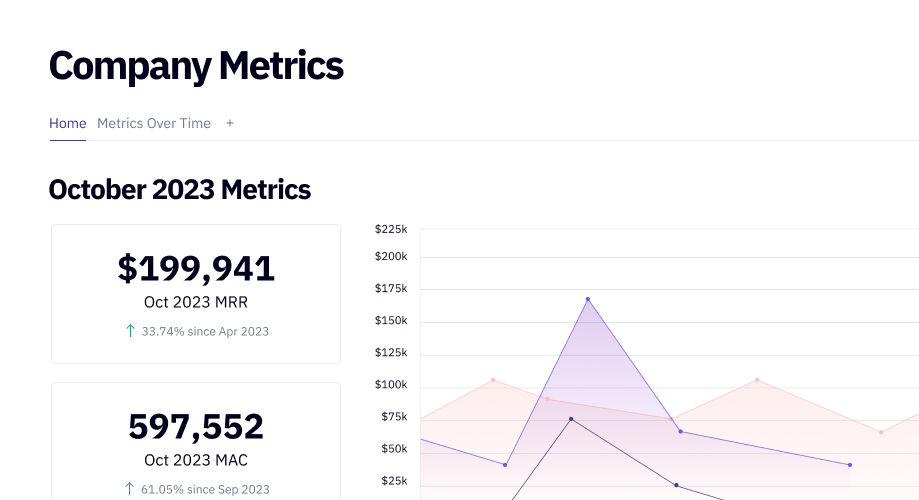
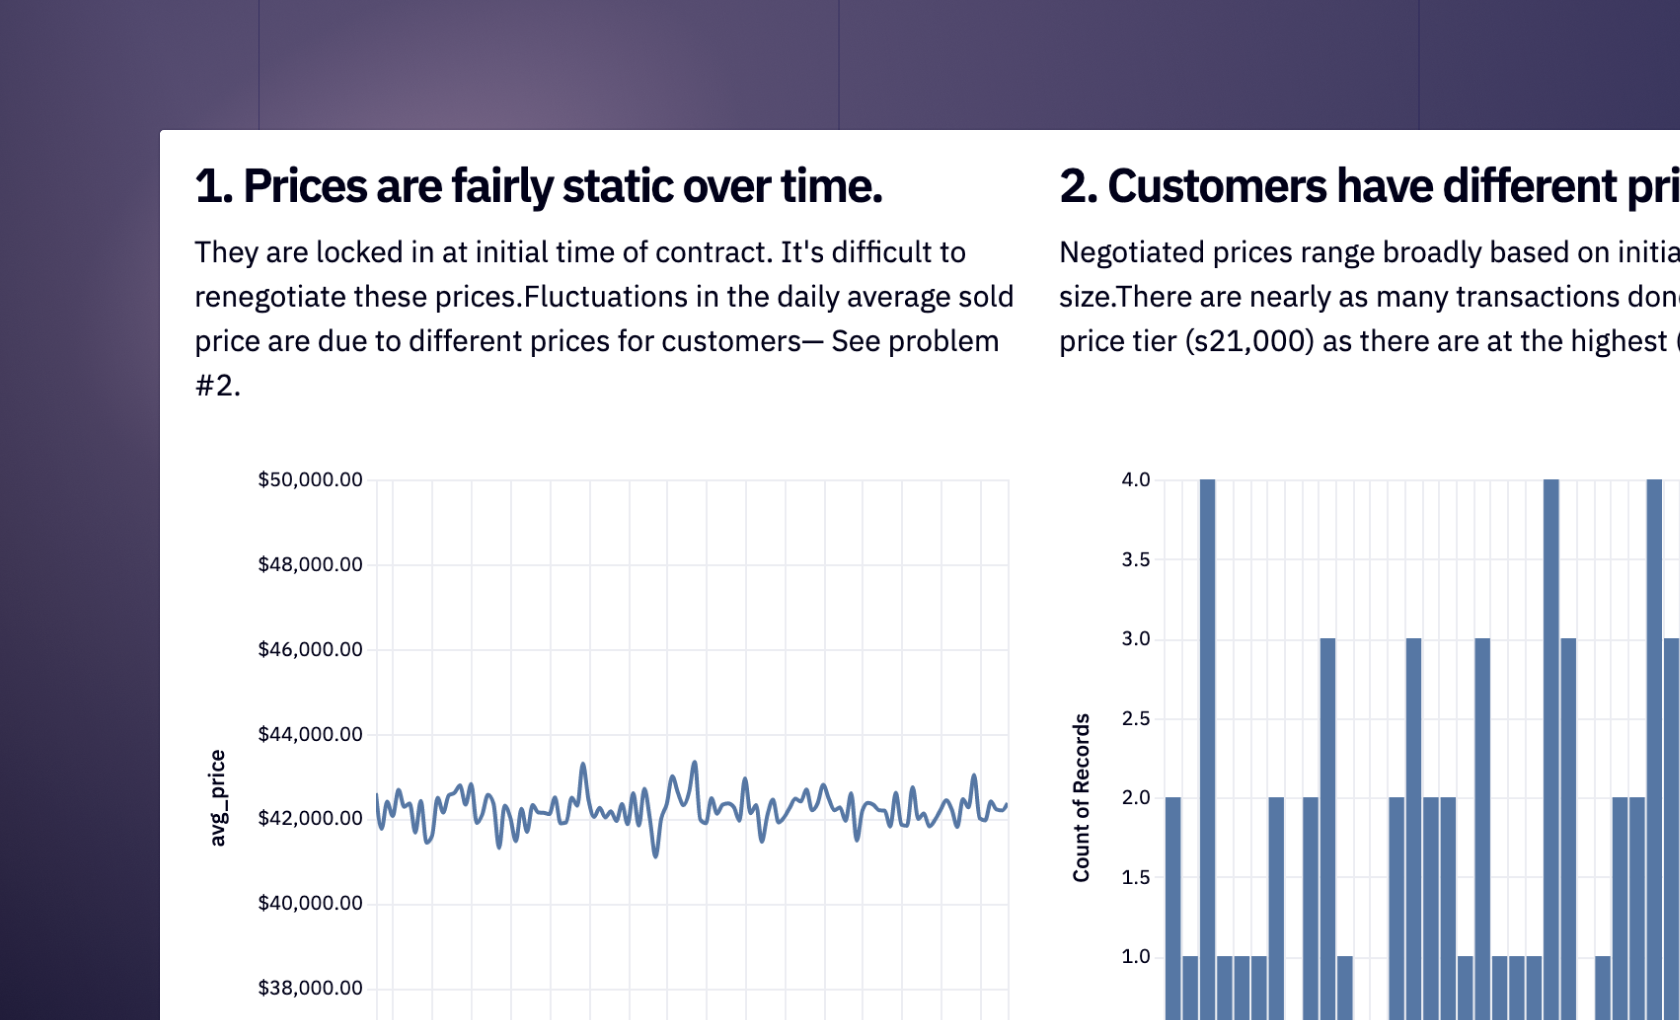
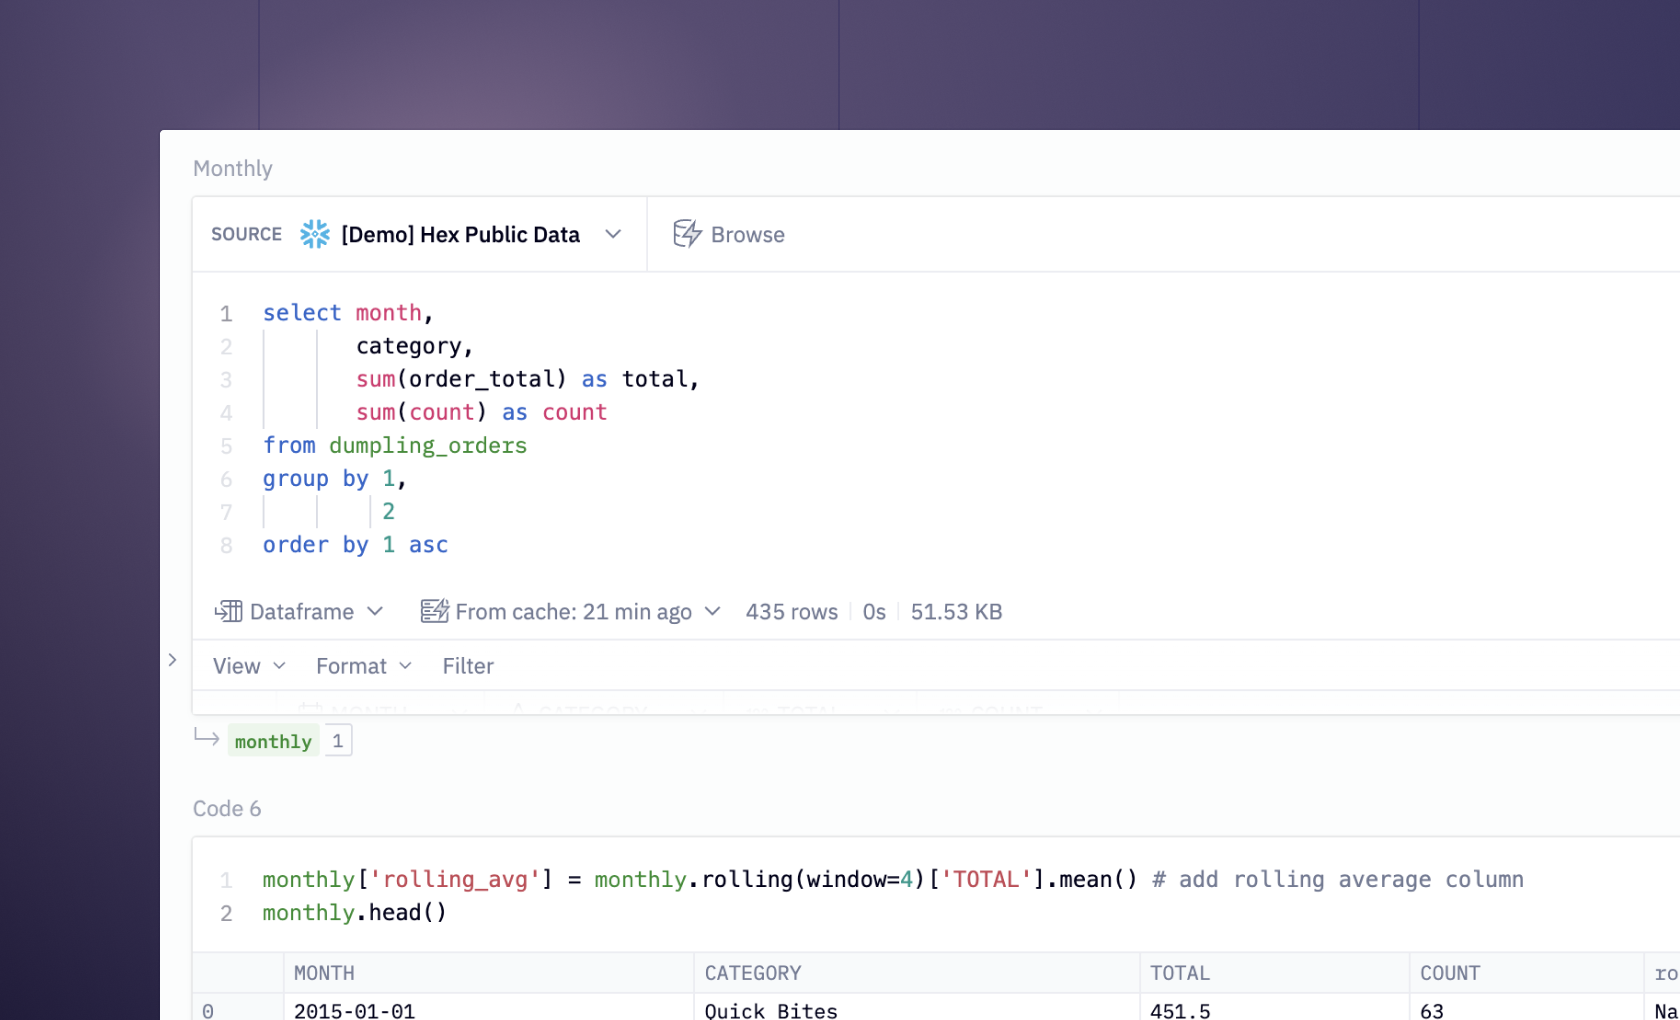
Beautiful visualizations
Interactive charts, tables, and maps bring your data to life— no coding required.
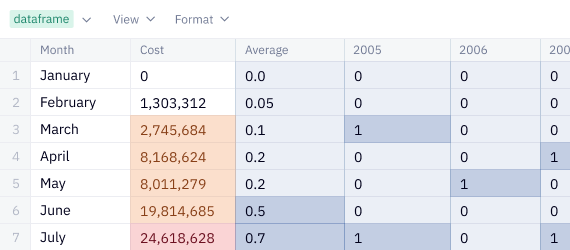
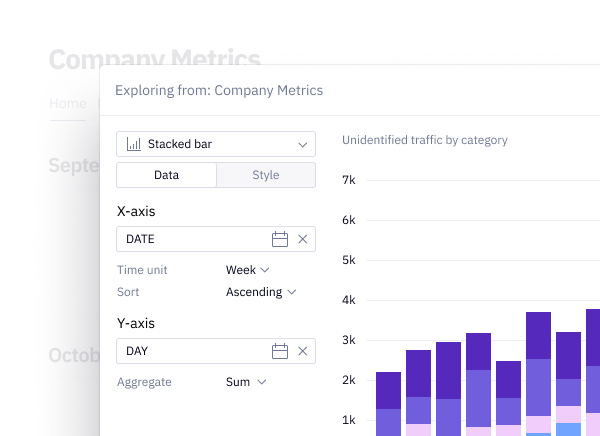
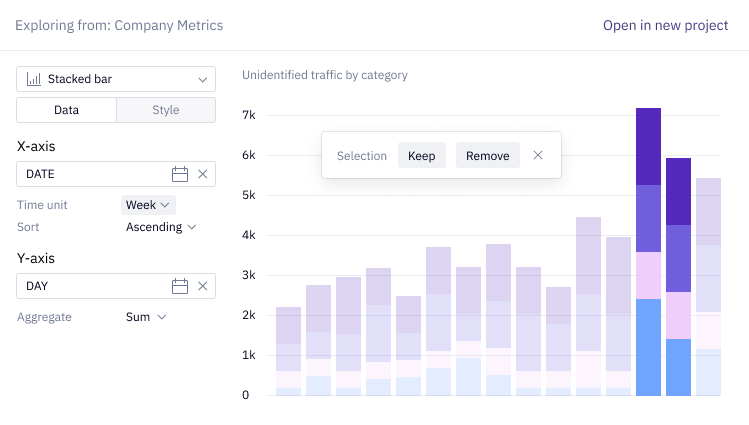
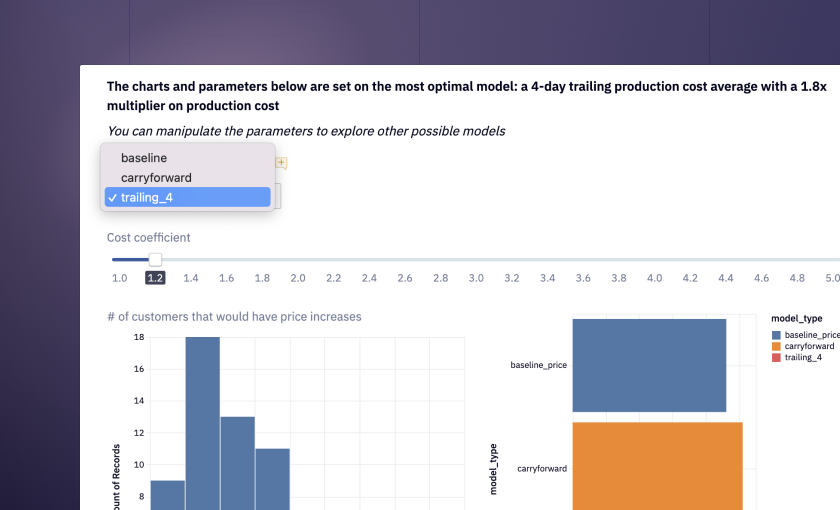
Explore, drill, filter
Every chart and table automatically comes ready to be drilled down, filtered, or used as a starting point for a completely new exploration.
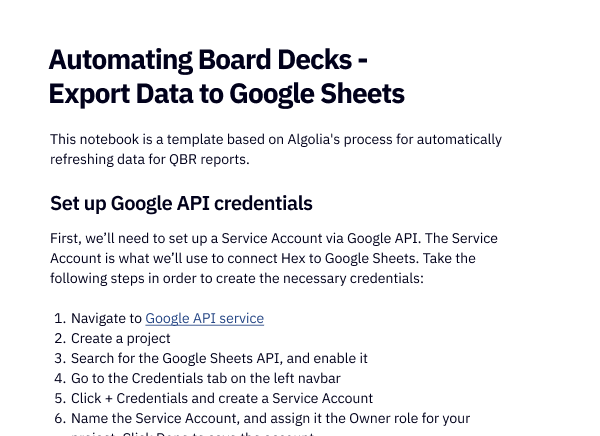
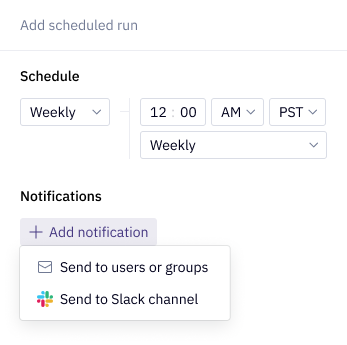
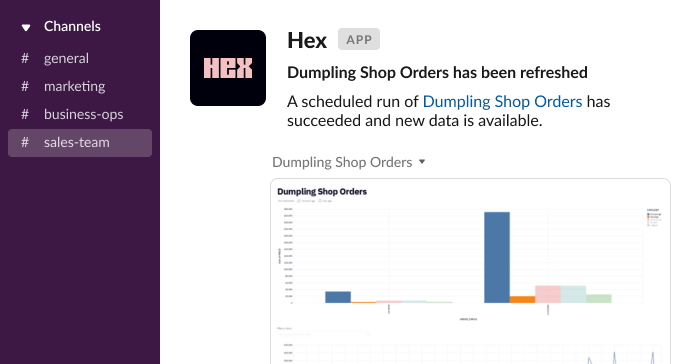
Answers right where you need them
Reports are always up to date with automatic upstream data syncs and scheduled runs via Slack or email.
Hex helped us provide a transparent and intuitive experience for the World Health Organization to make more informed decisions about how to reduce emissions.”

Nina Anderson · Head of Pre-Sales Engineering at Infinite Lambda

Hex enables us to deploy customer-facing analytics in days rather than weeks or months. Hex gives us super powers.”

Daniel McAuley · Data Lead at Inventa
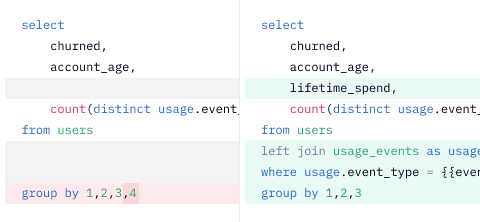
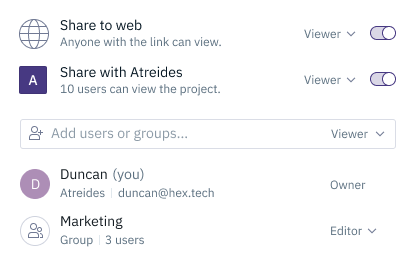
Tighten the feedback loop
When it's time to share your masterpiece, one URL keeps everyone on the same page — literally. Edits, comments, and revisions are fast and easy with real-time multiplayer and live updates.

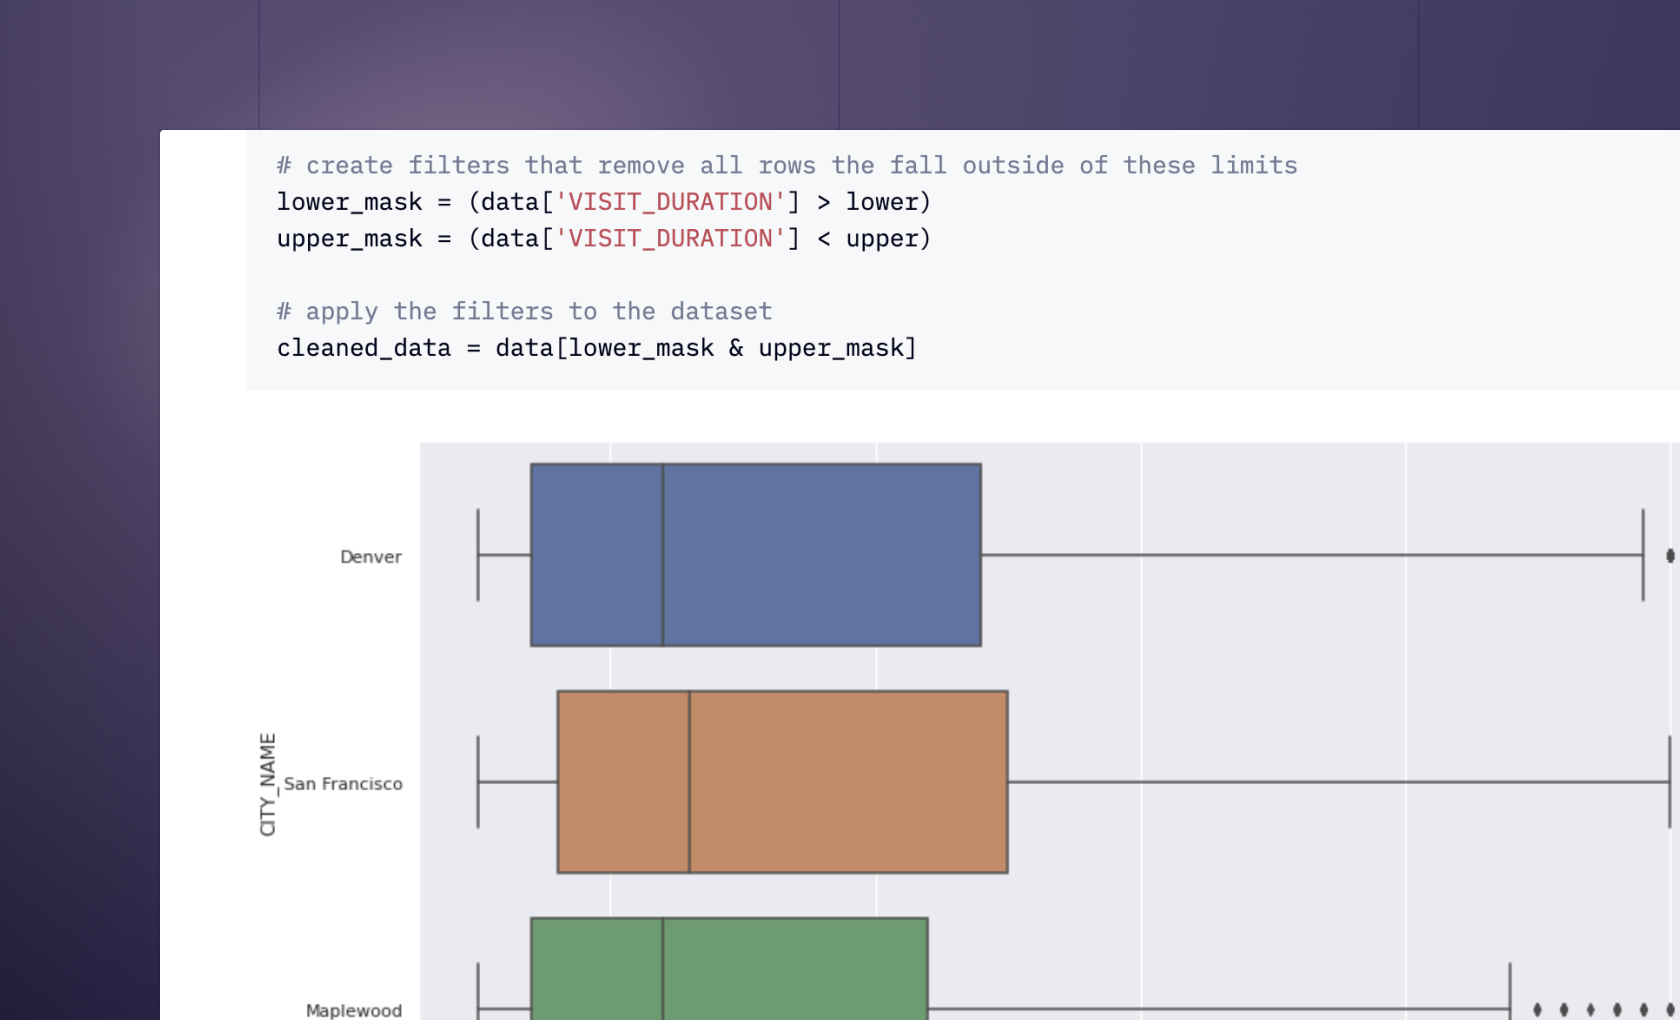
Build anything
Get started with one of our many template apps, from complex ML forecasting to critical business dashboards.
Questions? Talk to us
Get in touch with us to see a demo or find out which plan is right for you.