
What should the modern analytics workflow look like? To answer that question let's walk through a practical example flow:
If you’re lucky, it starts in a good IDE, but, likely, it starts in a console somewhere, with minimal syntax highlighting and perhaps autocomplete. 😬
After refreshing yourself on exactly what data structures you need to query, you spend the next few hours toying with SQL to get it right. Aha! You see something in the data! You can’t wait to share this with your team.
Now, onto visualizations— there are a few options, but you need to get the data there! So you can a) create a temp table, b) export a CSV, c) use a platform with built in visualization, which necessarily comes at a cost: usability (how do I make this work in Superset, again?)
During this process, you realize you made a few errors in your query: back to work! SQL, refresh temp table, change visualization, repeat. During my own iterations, I often realize my initial conclusion no longer holds. So it’s back to exploring data in SQL. 😓
After enduring this a few times, you finally have the visualizations nailed down. You know the data by heart. Everything is rock solid, but you have to share it with your stakeholder. What’s next? A deck, screenshots, a doc?
After spending a few more hours compiling your report, you send it to your work bestie, who points out a few more errors and inconsistencies. To change one chart, you’re back to re-running queries, tweaking colors in Plotly, and taking more screenshots. But it’s all worth it right? This has to be perfect.
You share the report with a PM expecting to be immediately inducted into the analytics hall of fame. Surely, this will revolutionize how you do business and skyrocket the company to record growth.
Their response? This is great, but I’m really interested in [this one tiny footnote adjacent to the analysis]. Back to the drawing board.
Analytics takes Iteration
The truth is that for many analytics teams, workflow efficiency doesn’t get much thought. This isn’t for a lack of effort— it’s quite difficult to find best practices in analytics and teams are busy supporting other teams and execs. But let's examine the workflow and see how the tools involved can improve it.
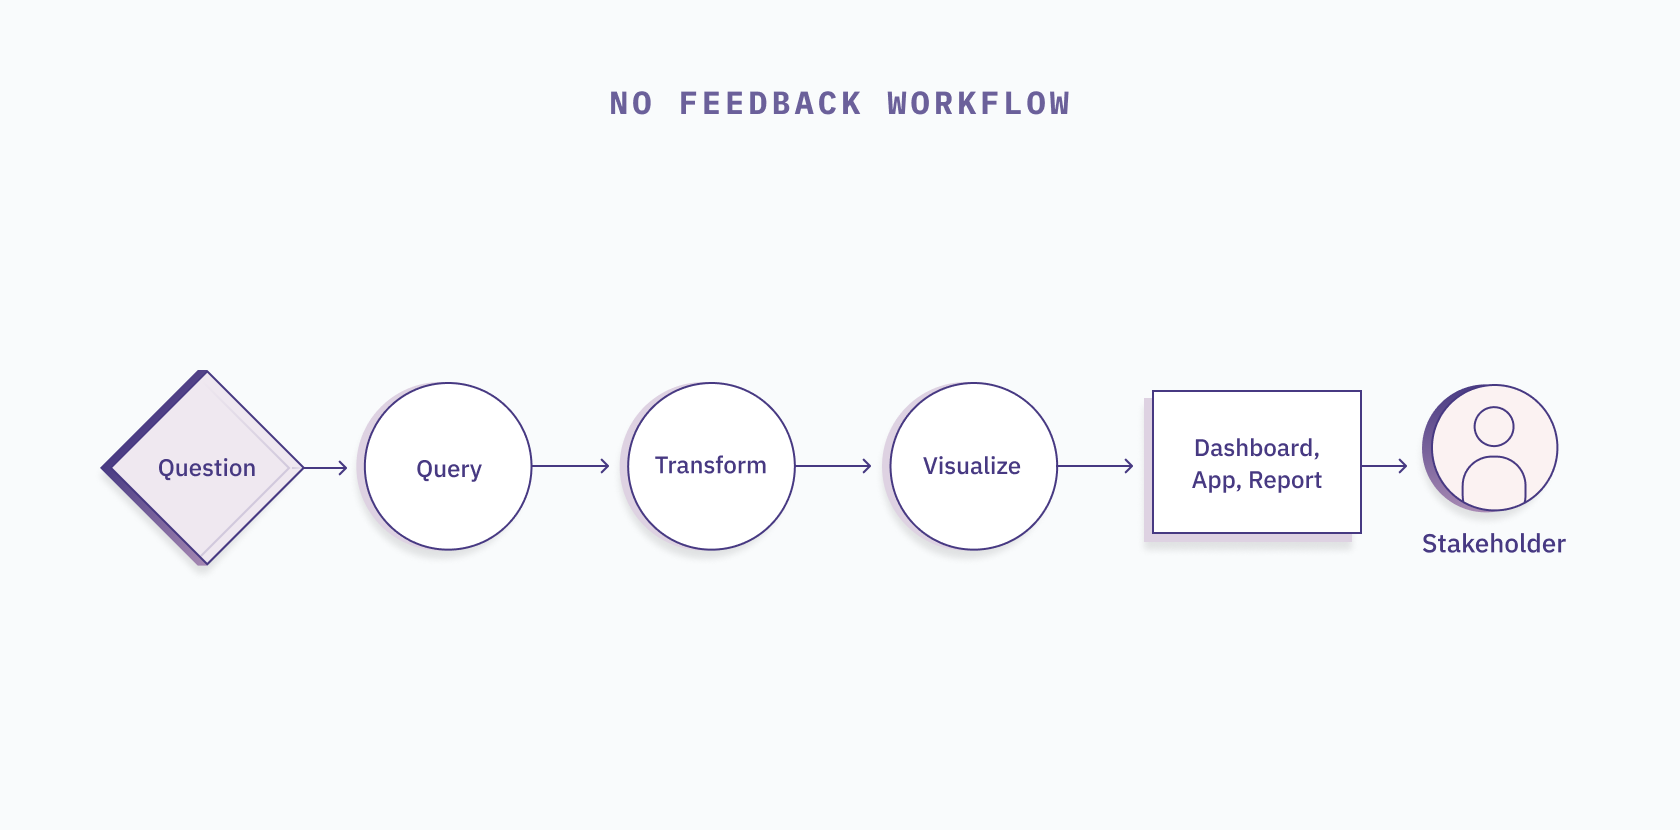
The basic analytics workflow looks something like this:
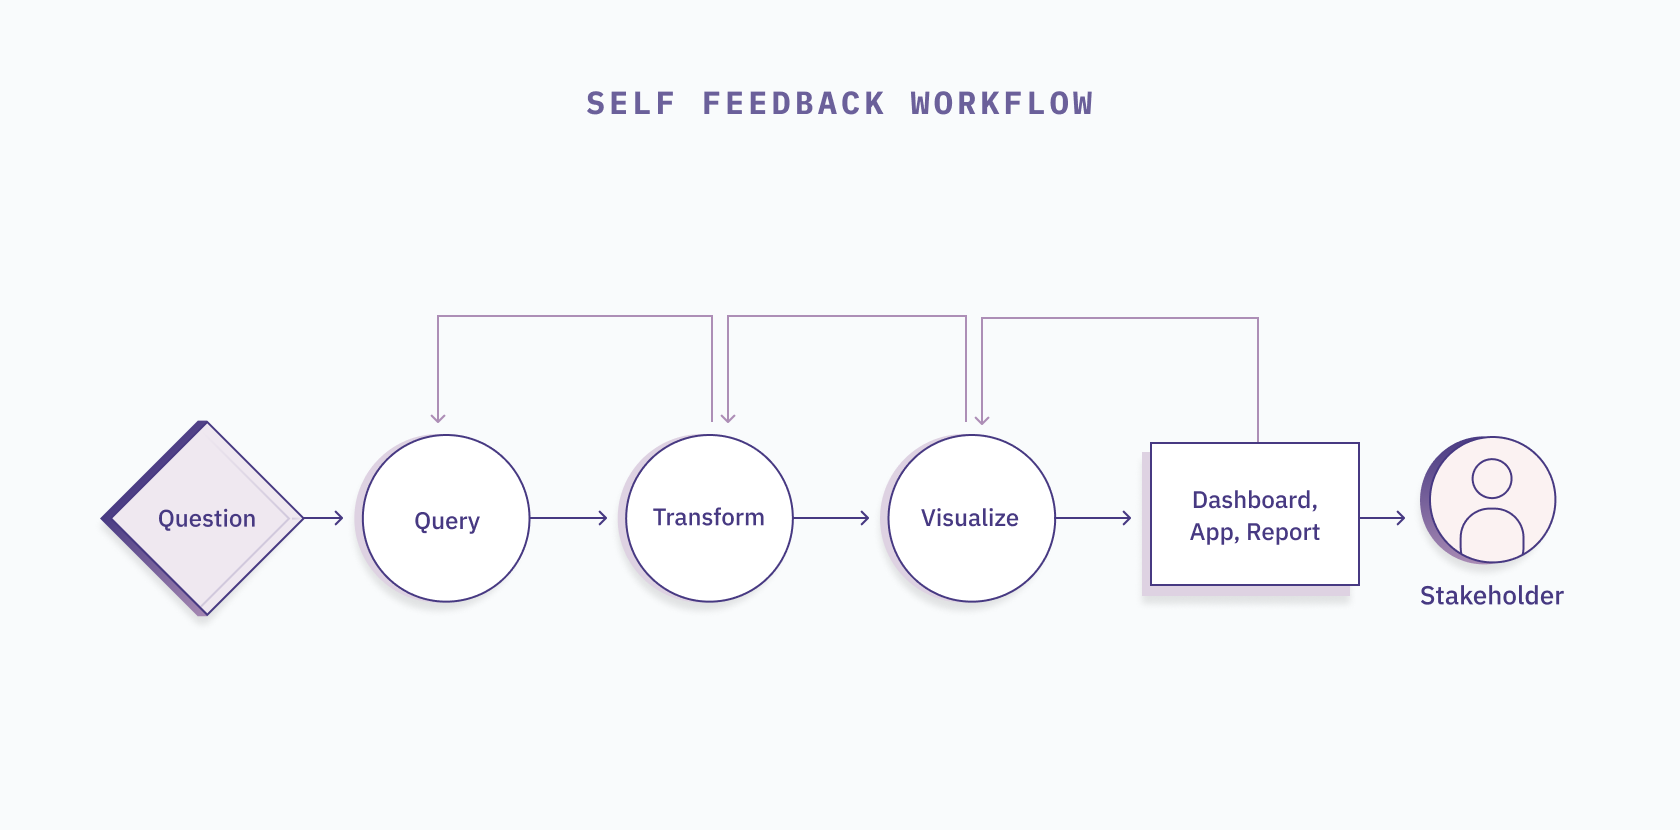
In reality, during our process we come up with new questions, queries, charts, and more to get confident about the results we want to share. We critique what’s in the dashboard, we notice we forgot a WHERE clause, we want to change the color in a bar chart. We go back into our tools and code to update things and rebuild the final report. This self-iterative workflow helps us ultimately deliver better reports to share with others.
After finishing our work, we share it out and that’s when the real feedback kicks in. Why are sales not up and to the right? Did you filter out Acme, Inc? Please use our brand colors!
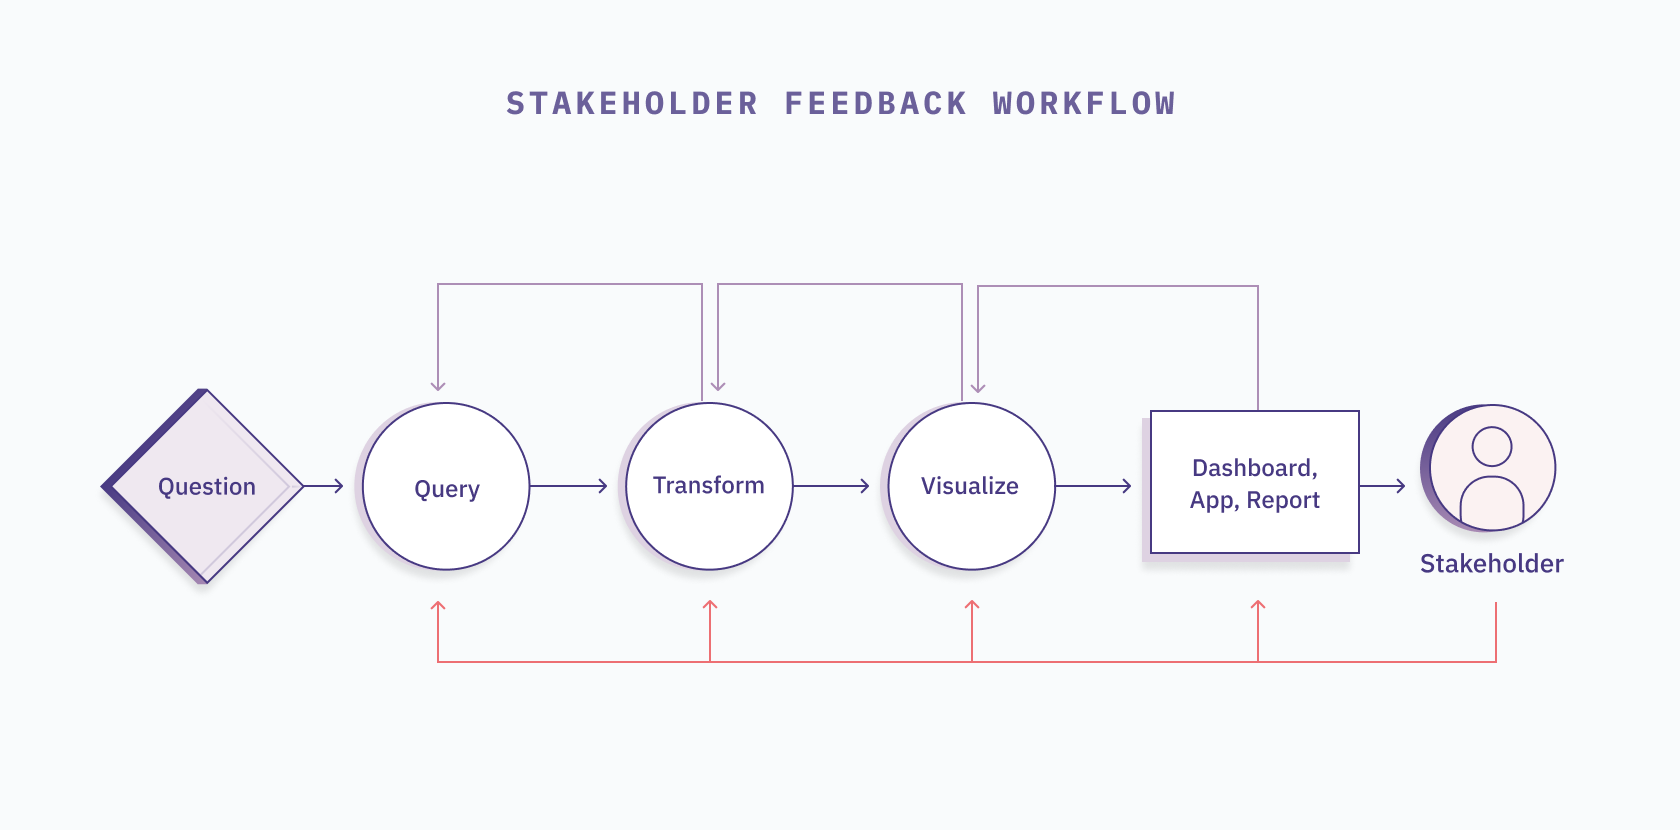
At every step of the analytics workflow you or your stakeholder might have feedback that you need to incorporate. These change can span between SQL, Python, pivots, charts, dashboards, colors, and controls. Lets now jump into how the right tools can make the iterative analytics process better.
Iterating with One Tool vs Multiple
Feedback and iterations are part of the process so how much work is it to incorporate one piece of feedback from the stakeholder about our query? If we use a variety of tools as mentioned in the first example (SQL IDE, notebook, sheets, and a slide deck) we have to recreate and copy over work between tools several times to get the updated dashboard back to the stakeholder.
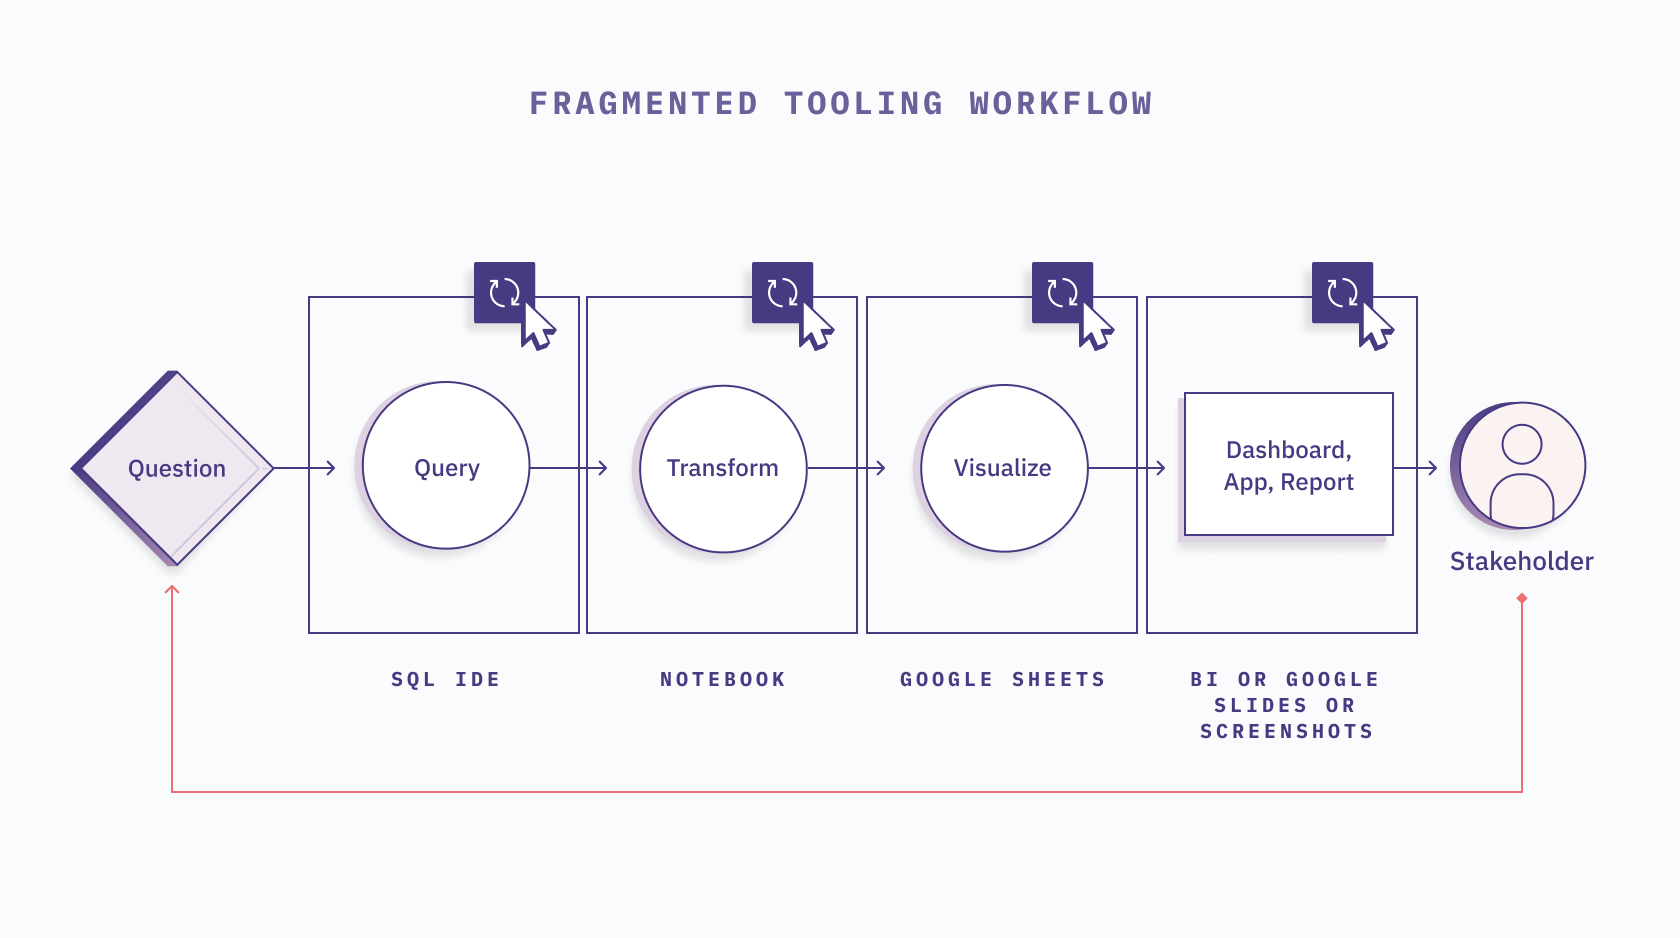
We would explore the data in the SQL IDE, copy the relevant query into the notebook, adjust transformation code, update visualization code, take screenshots of the new charts, paste them into slides and share. Jeez, that's a lot of work...
And this is why tools like Hex were created. Hex combines a SQL IDE with a Notebook with a no-code visualization tool with an interactive report builder so that a change in the code can update the final output in just one click.
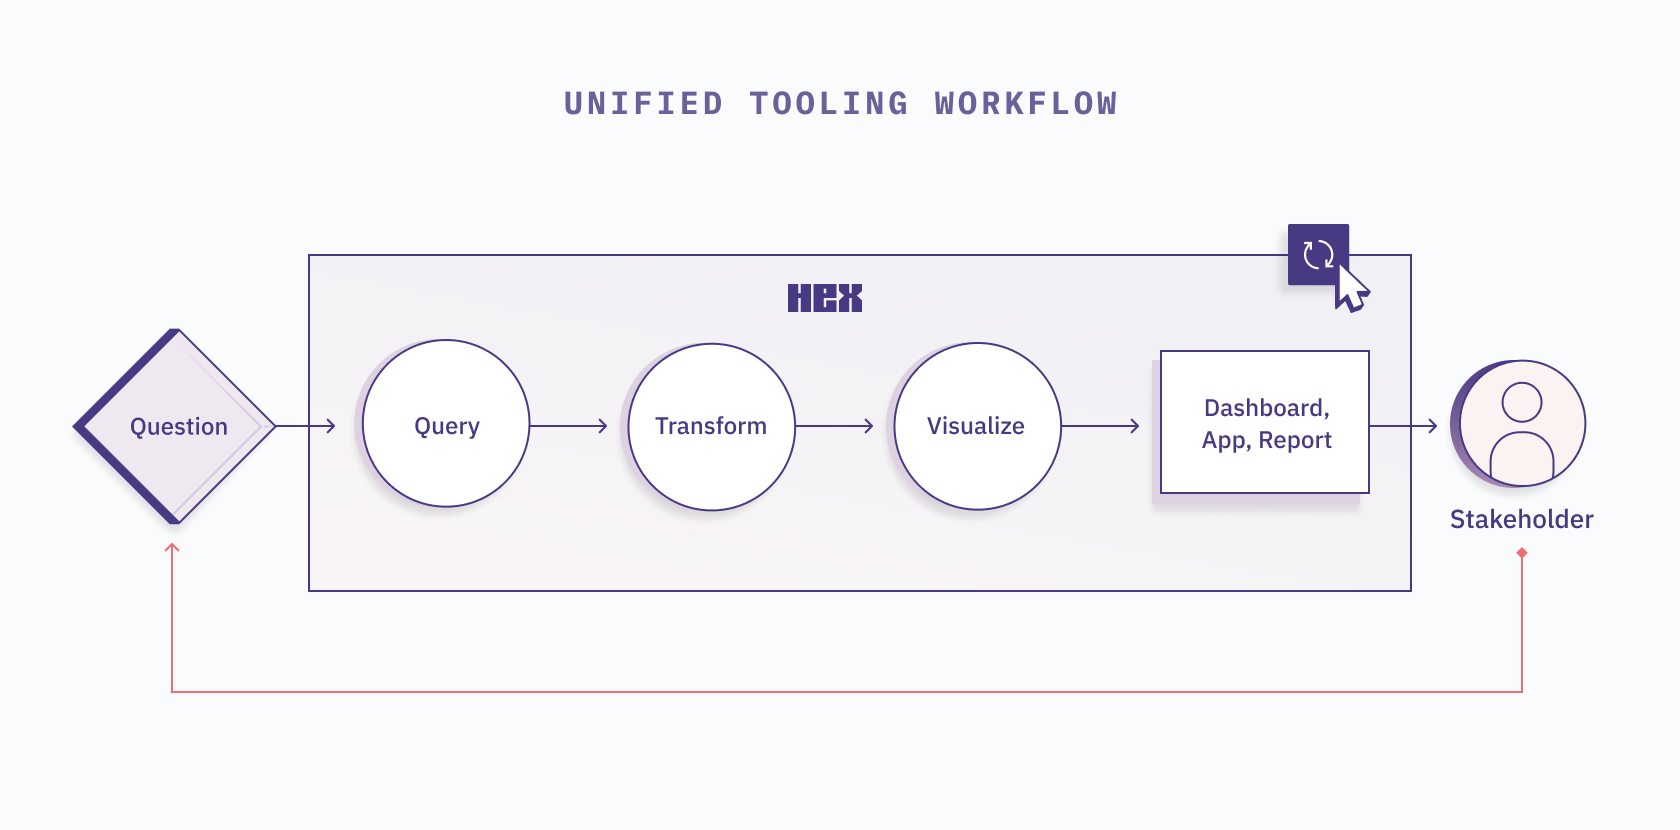
With the whole workflow in one place it allows you to update once or in a few areas and instantly have your shared report reflect that, ready for more feedback.
Modern Analytics needs End to End tools
Analytics is an iterative process. Iteration is not just a solo exercise, but a collaborative one. Stakeholders become involved in the reporting and insight stages, but they might ask for changes that affect the query level, too.
Simplifying workflows by using a single tool that integrates an entire analysis, from query to report, can drastically reduce analytics feedback loops. The difficulty of pulling a WHERE statement through to a chart should not be understated… it’s still notoriously difficult for many.
Single tools that consolidate workflows also reduce cognitive load. Without checking multiple Duo prompts and rifling through windows and tabs, analysts can more easily focus on the task at hand. This reduction in context switching also facilitates flow. It’s much easier to dig into a tough problem and immerse yourself in a single environment.
For the practitioner, I have a simple recommendation: spend considerable time and effort evaluating your workflows. If you find your days filled with inefficiency and distraction, take small, reasonable steps to resolve them.
Demo tools like Hex and see if they’re more efficient than how you’re currently doing things. I guarantee your peers will appreciate a well-intentioned recommendation.